
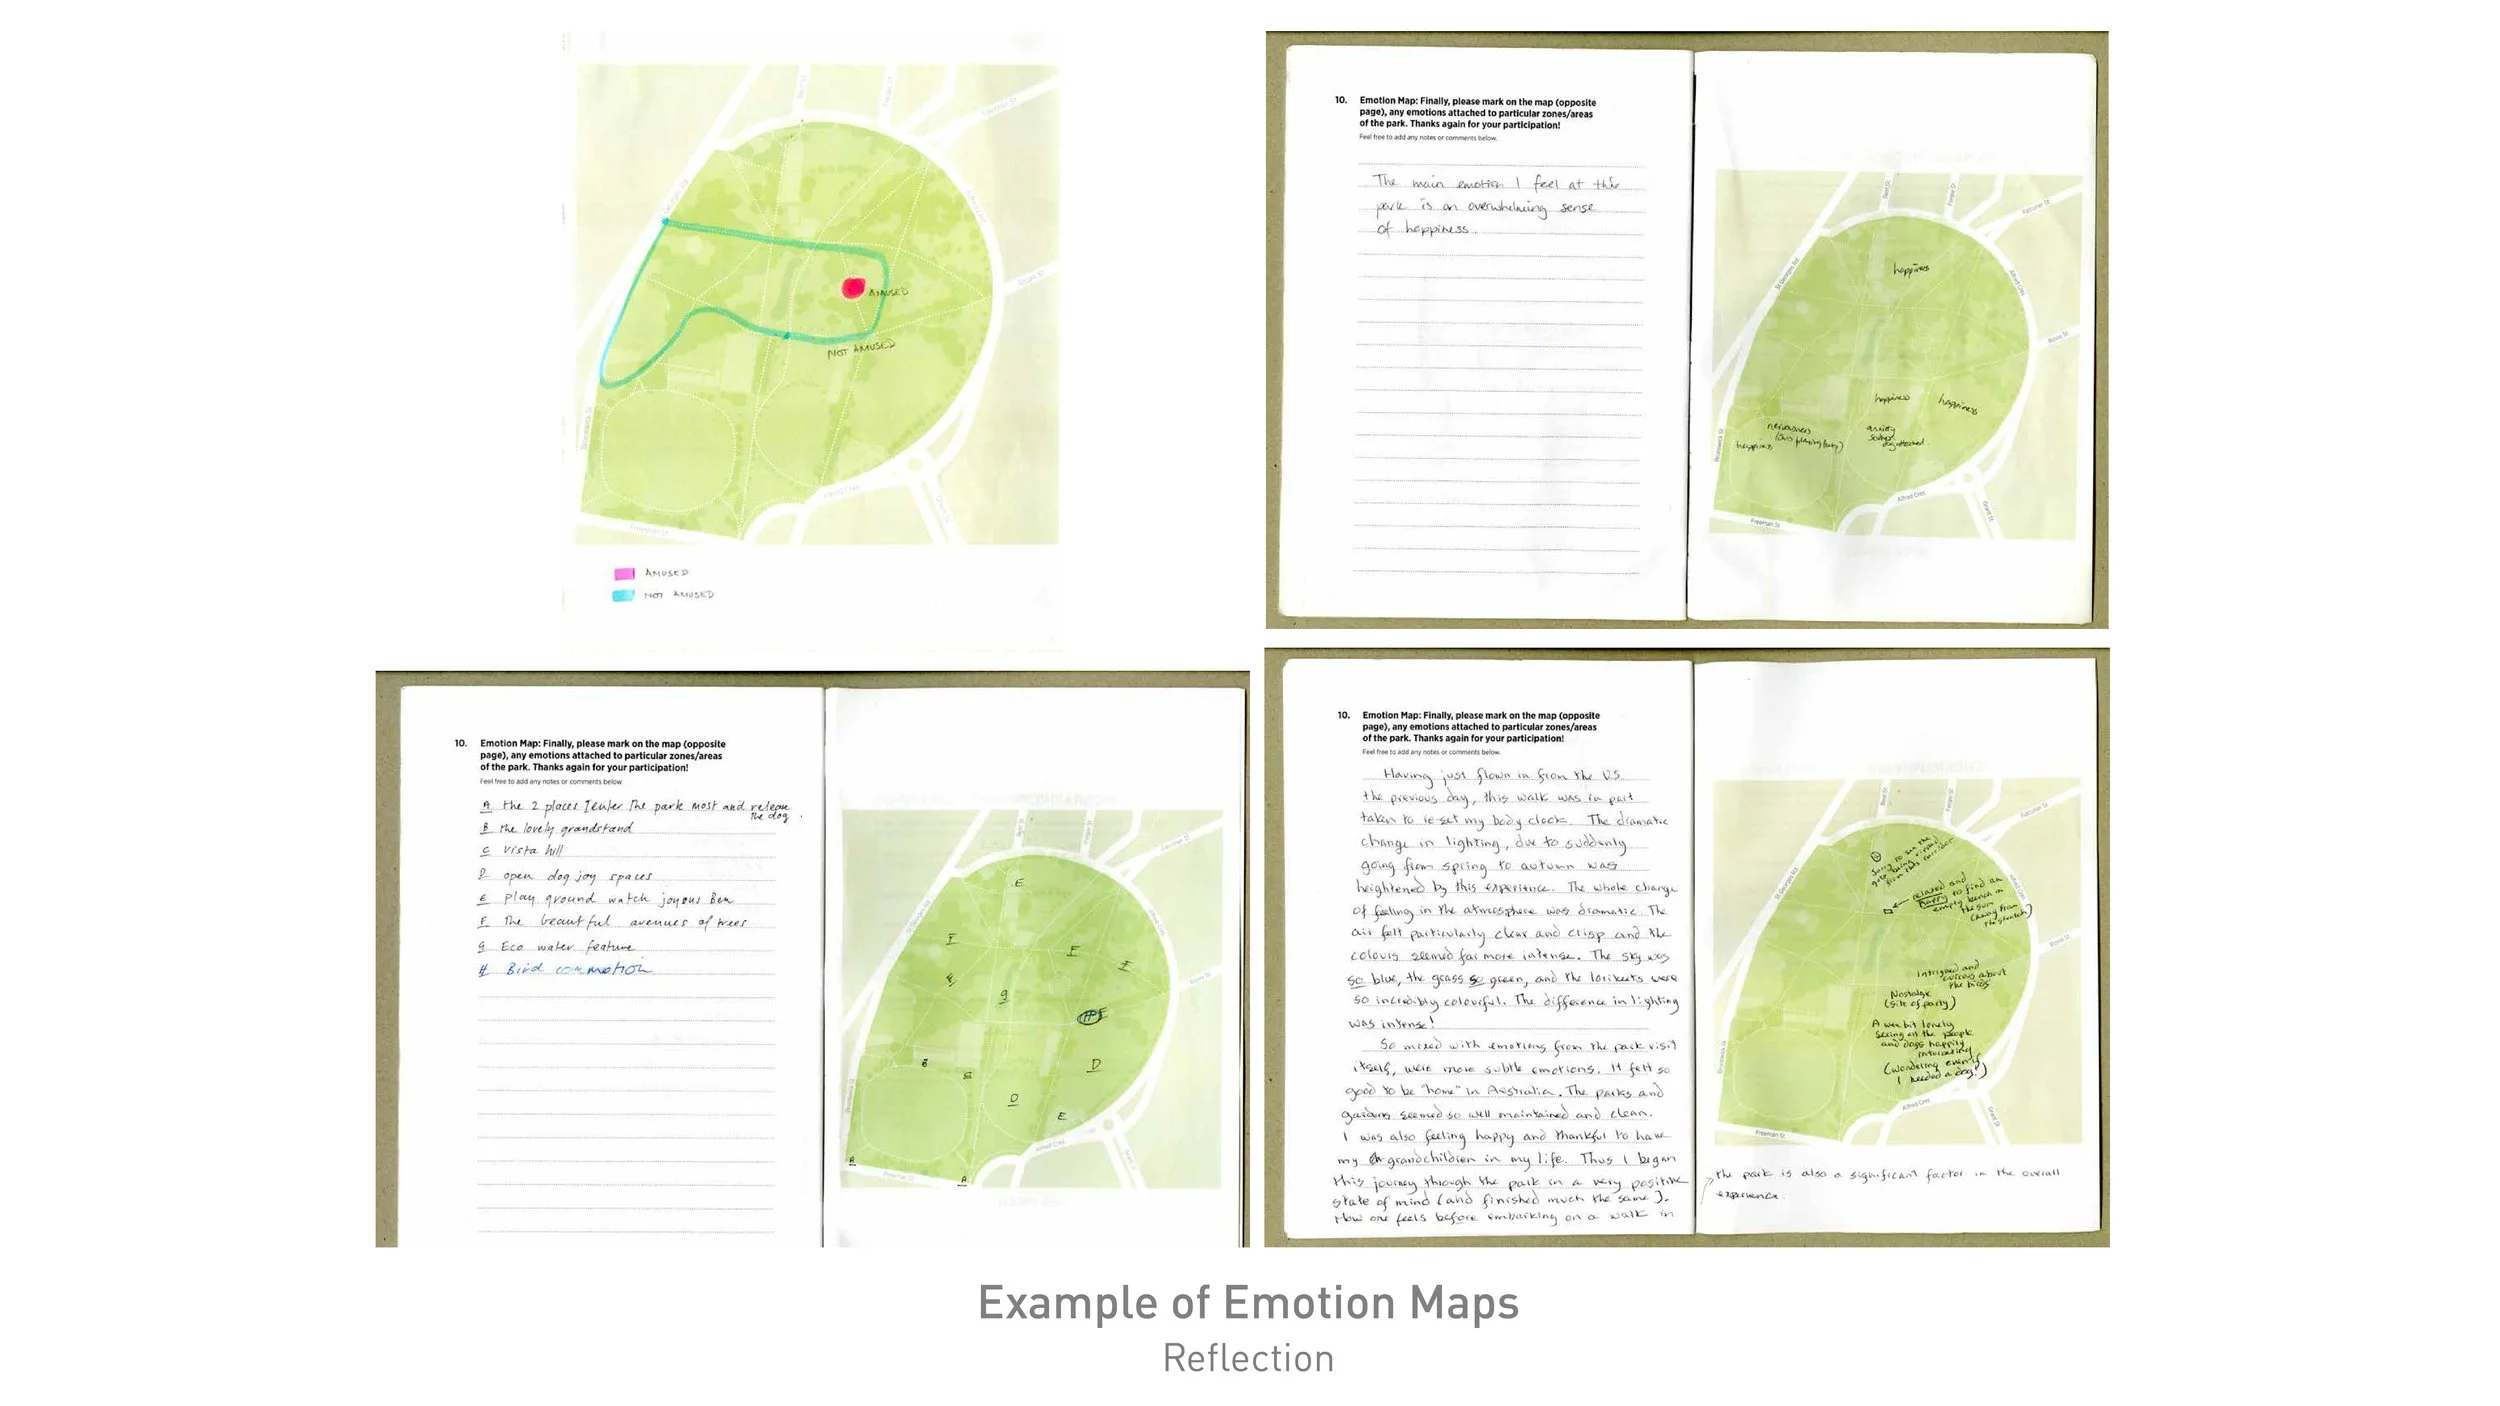
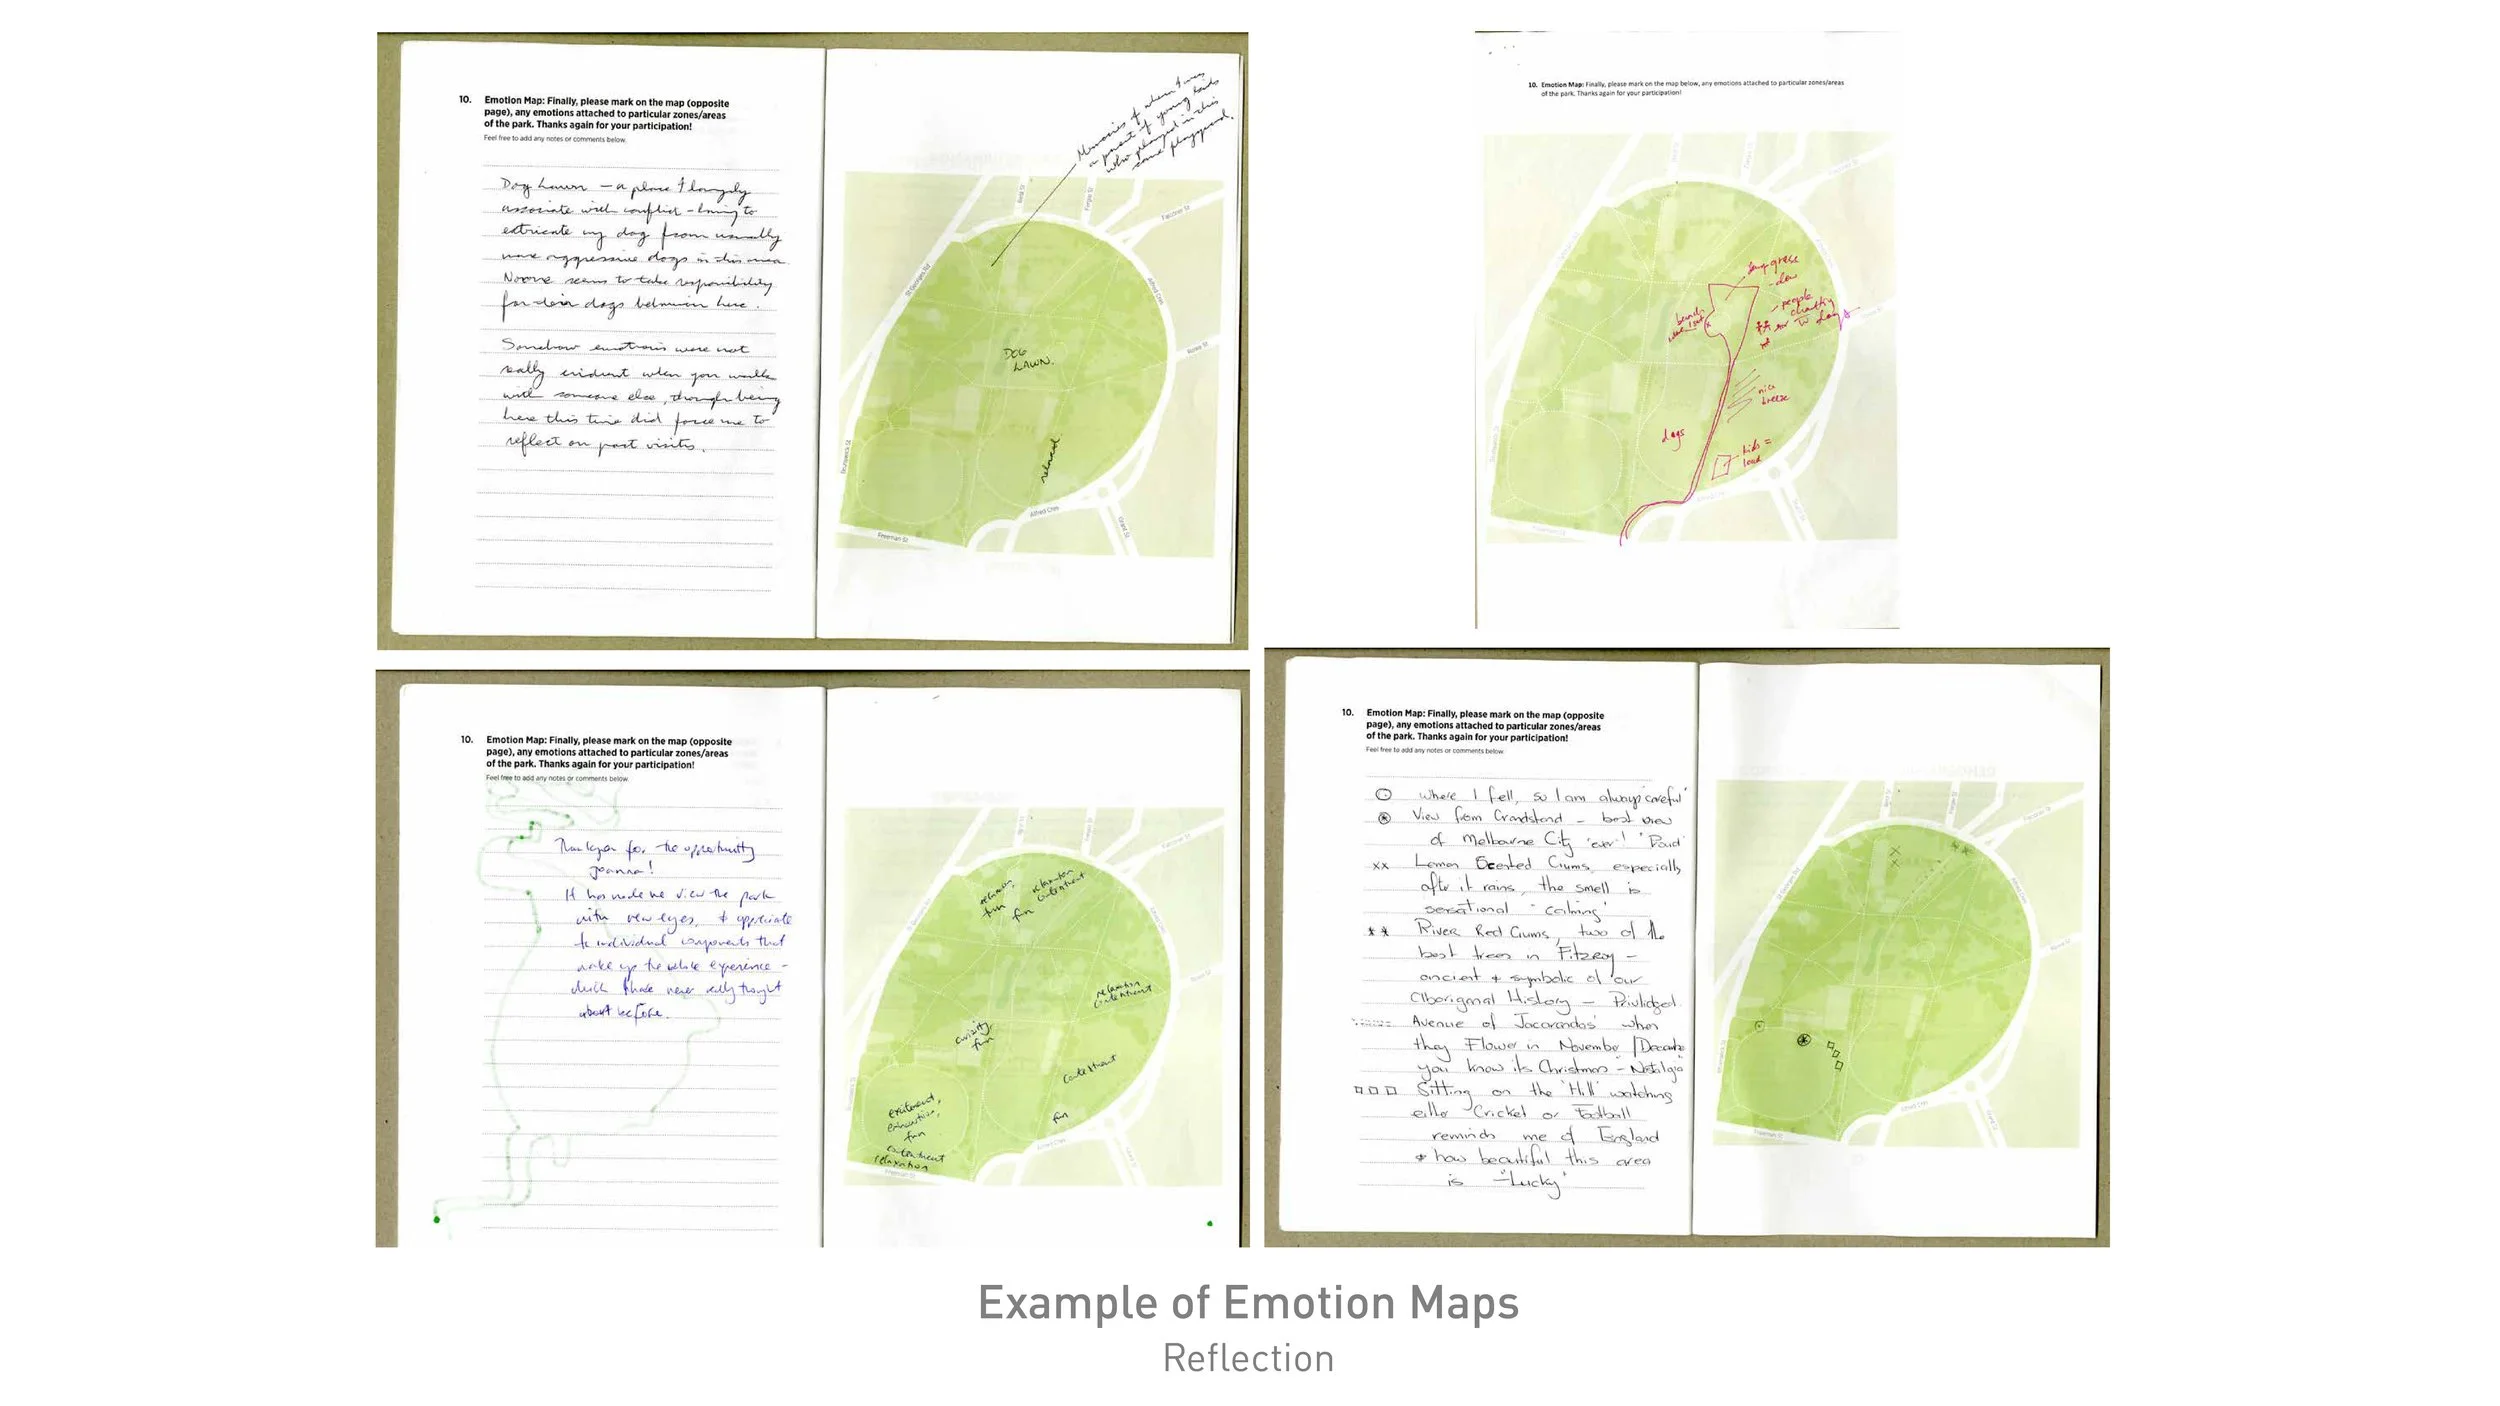
Emotion Maps
These emotion maps shared the same base map of the Edinburgh Gardens. I was able to compare each participant’s emotional point of view and perceptions of the park in specific zones within the park. The base map showed the entirety of the park, like a template, which opened the park up for participants to provide an emotional overview, not limiting the participant’s emotions to just one experience or memory of a designated area. Using Nvivo, I used the data to create categories and coded them as events, experiences (positive and negative), emotions, the body, weather, objects and moments of significance, and perceptions of the park. With these codes I could delve deeper and create nodes and tags specific to words describing the participant’s emotions, based on the data from the surveys. By generating these different groupings, I could compare the emotions and the effects of these emotions associated with these experiences.


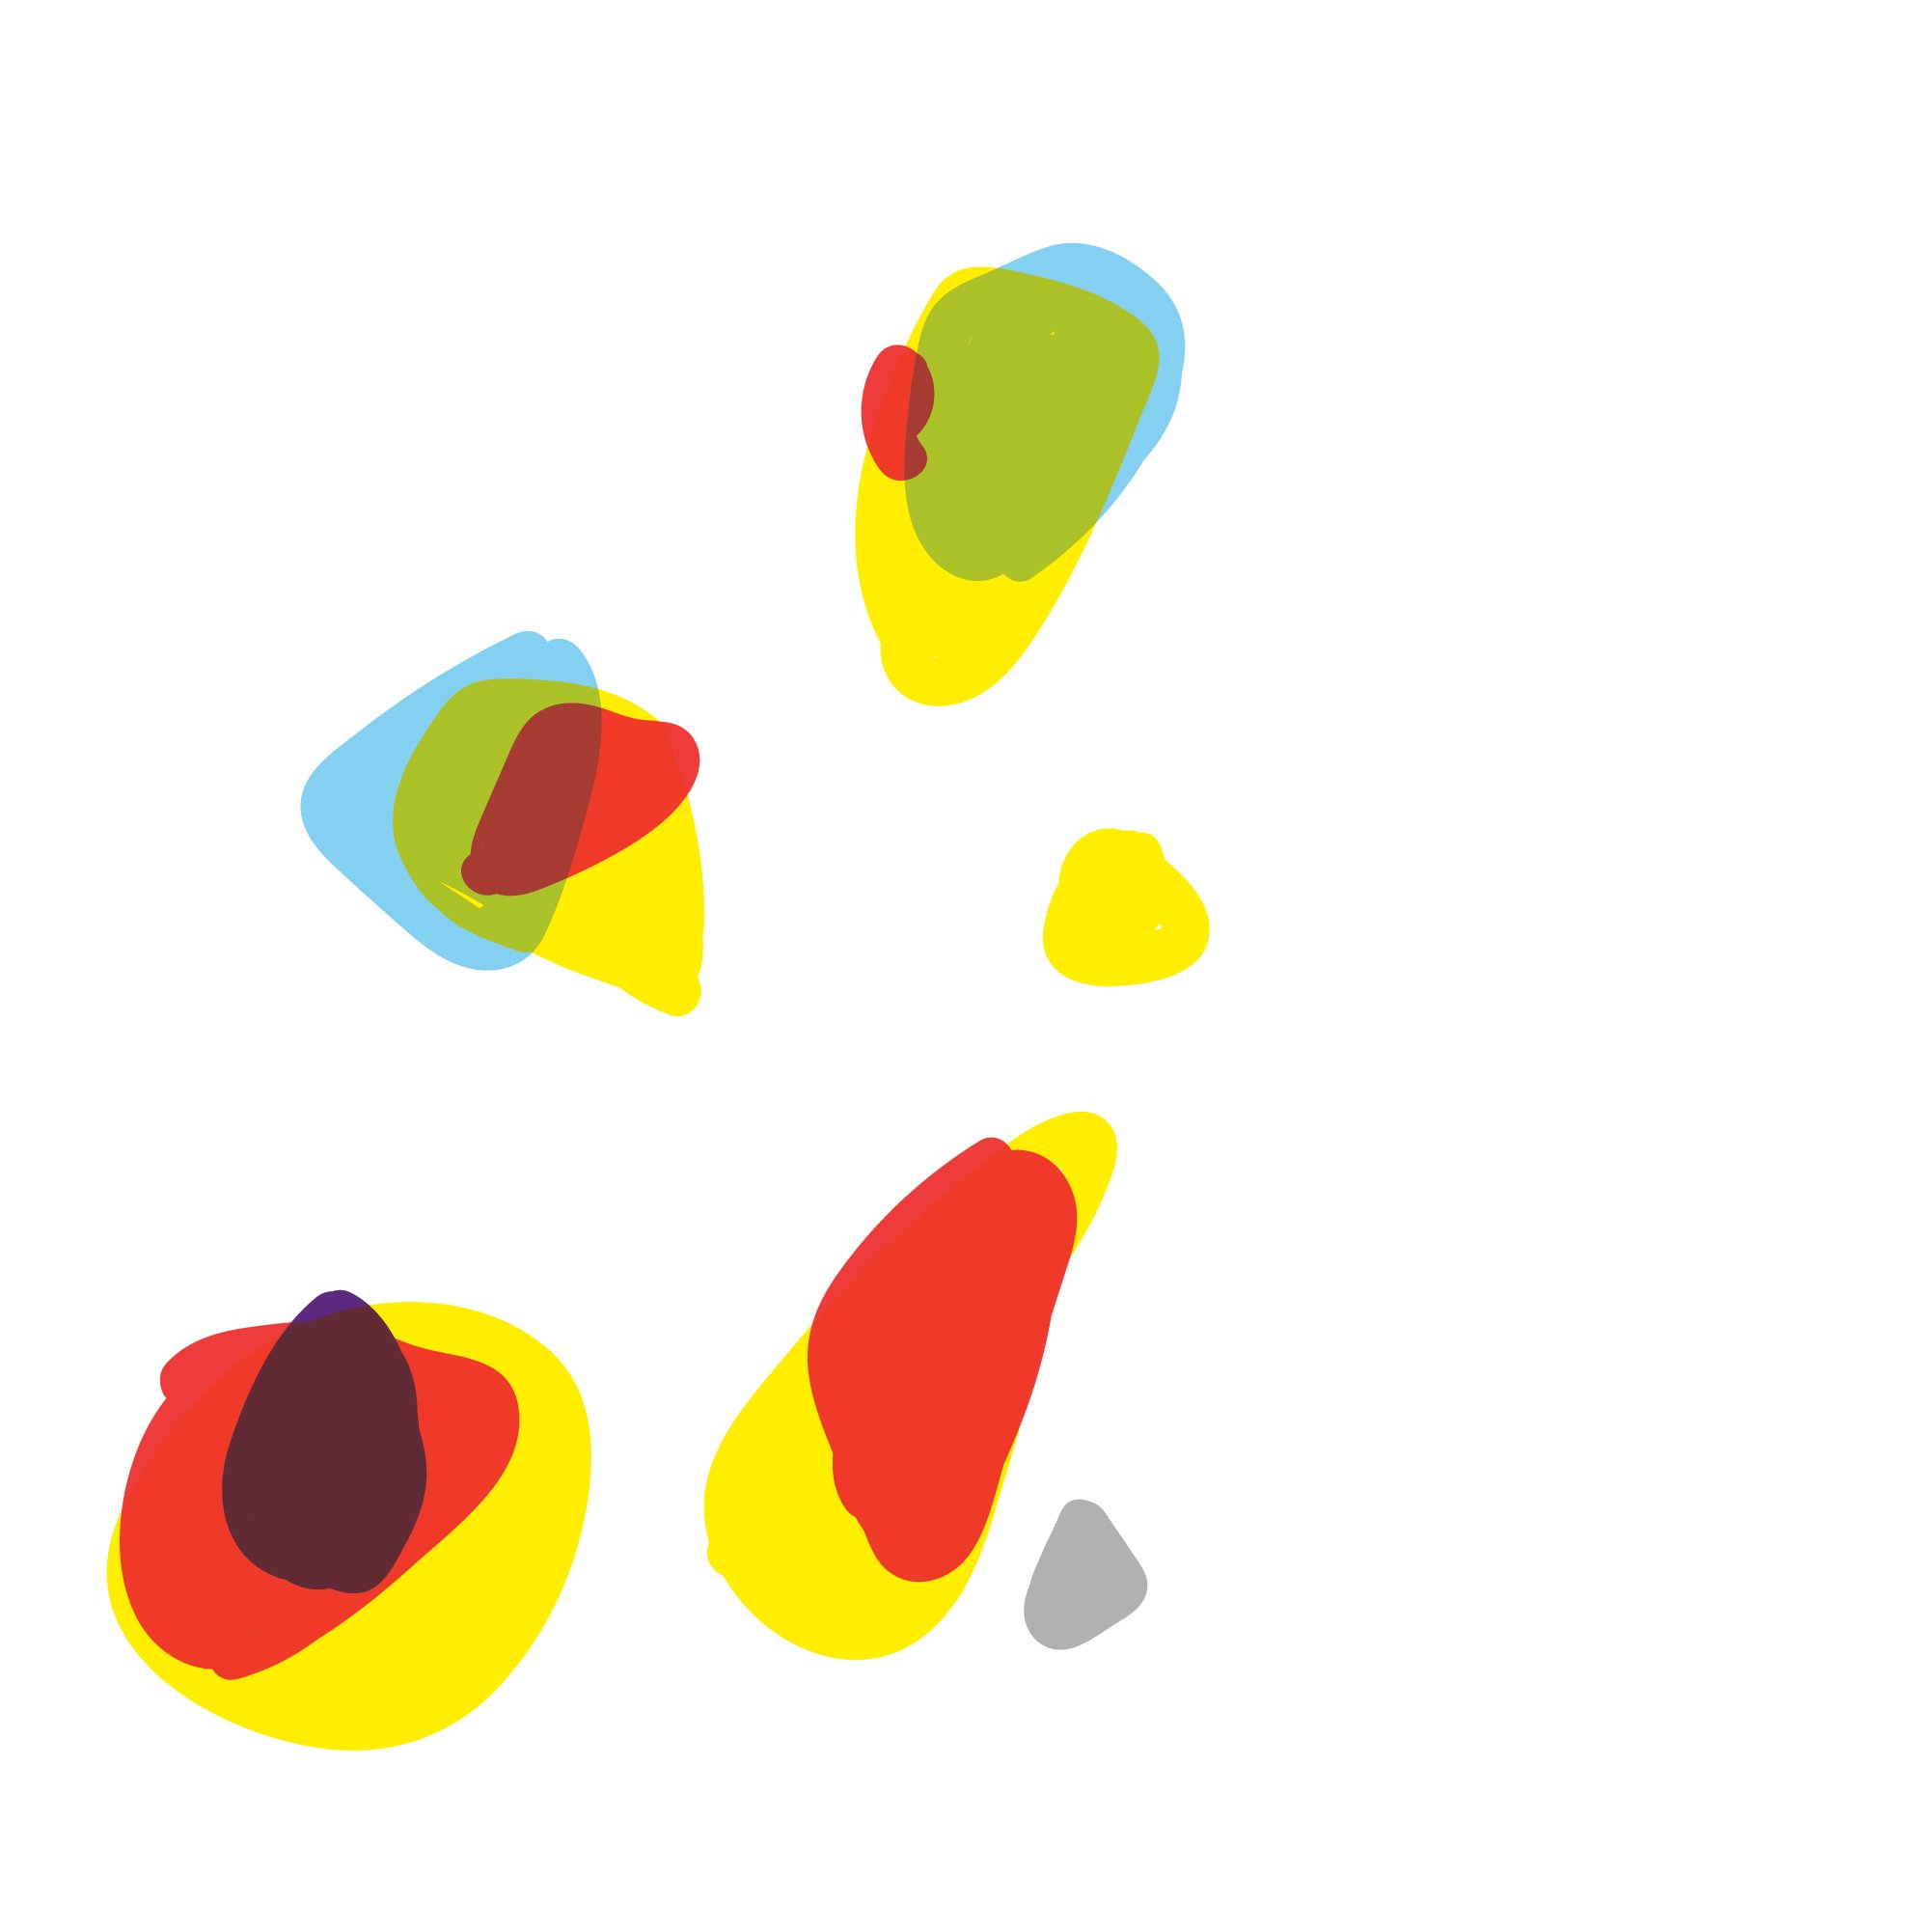


Overlaying the emotions on the base map of the park

Overlaying and colour coding the emotions on the base map of the park
Example base maps
Example base maps
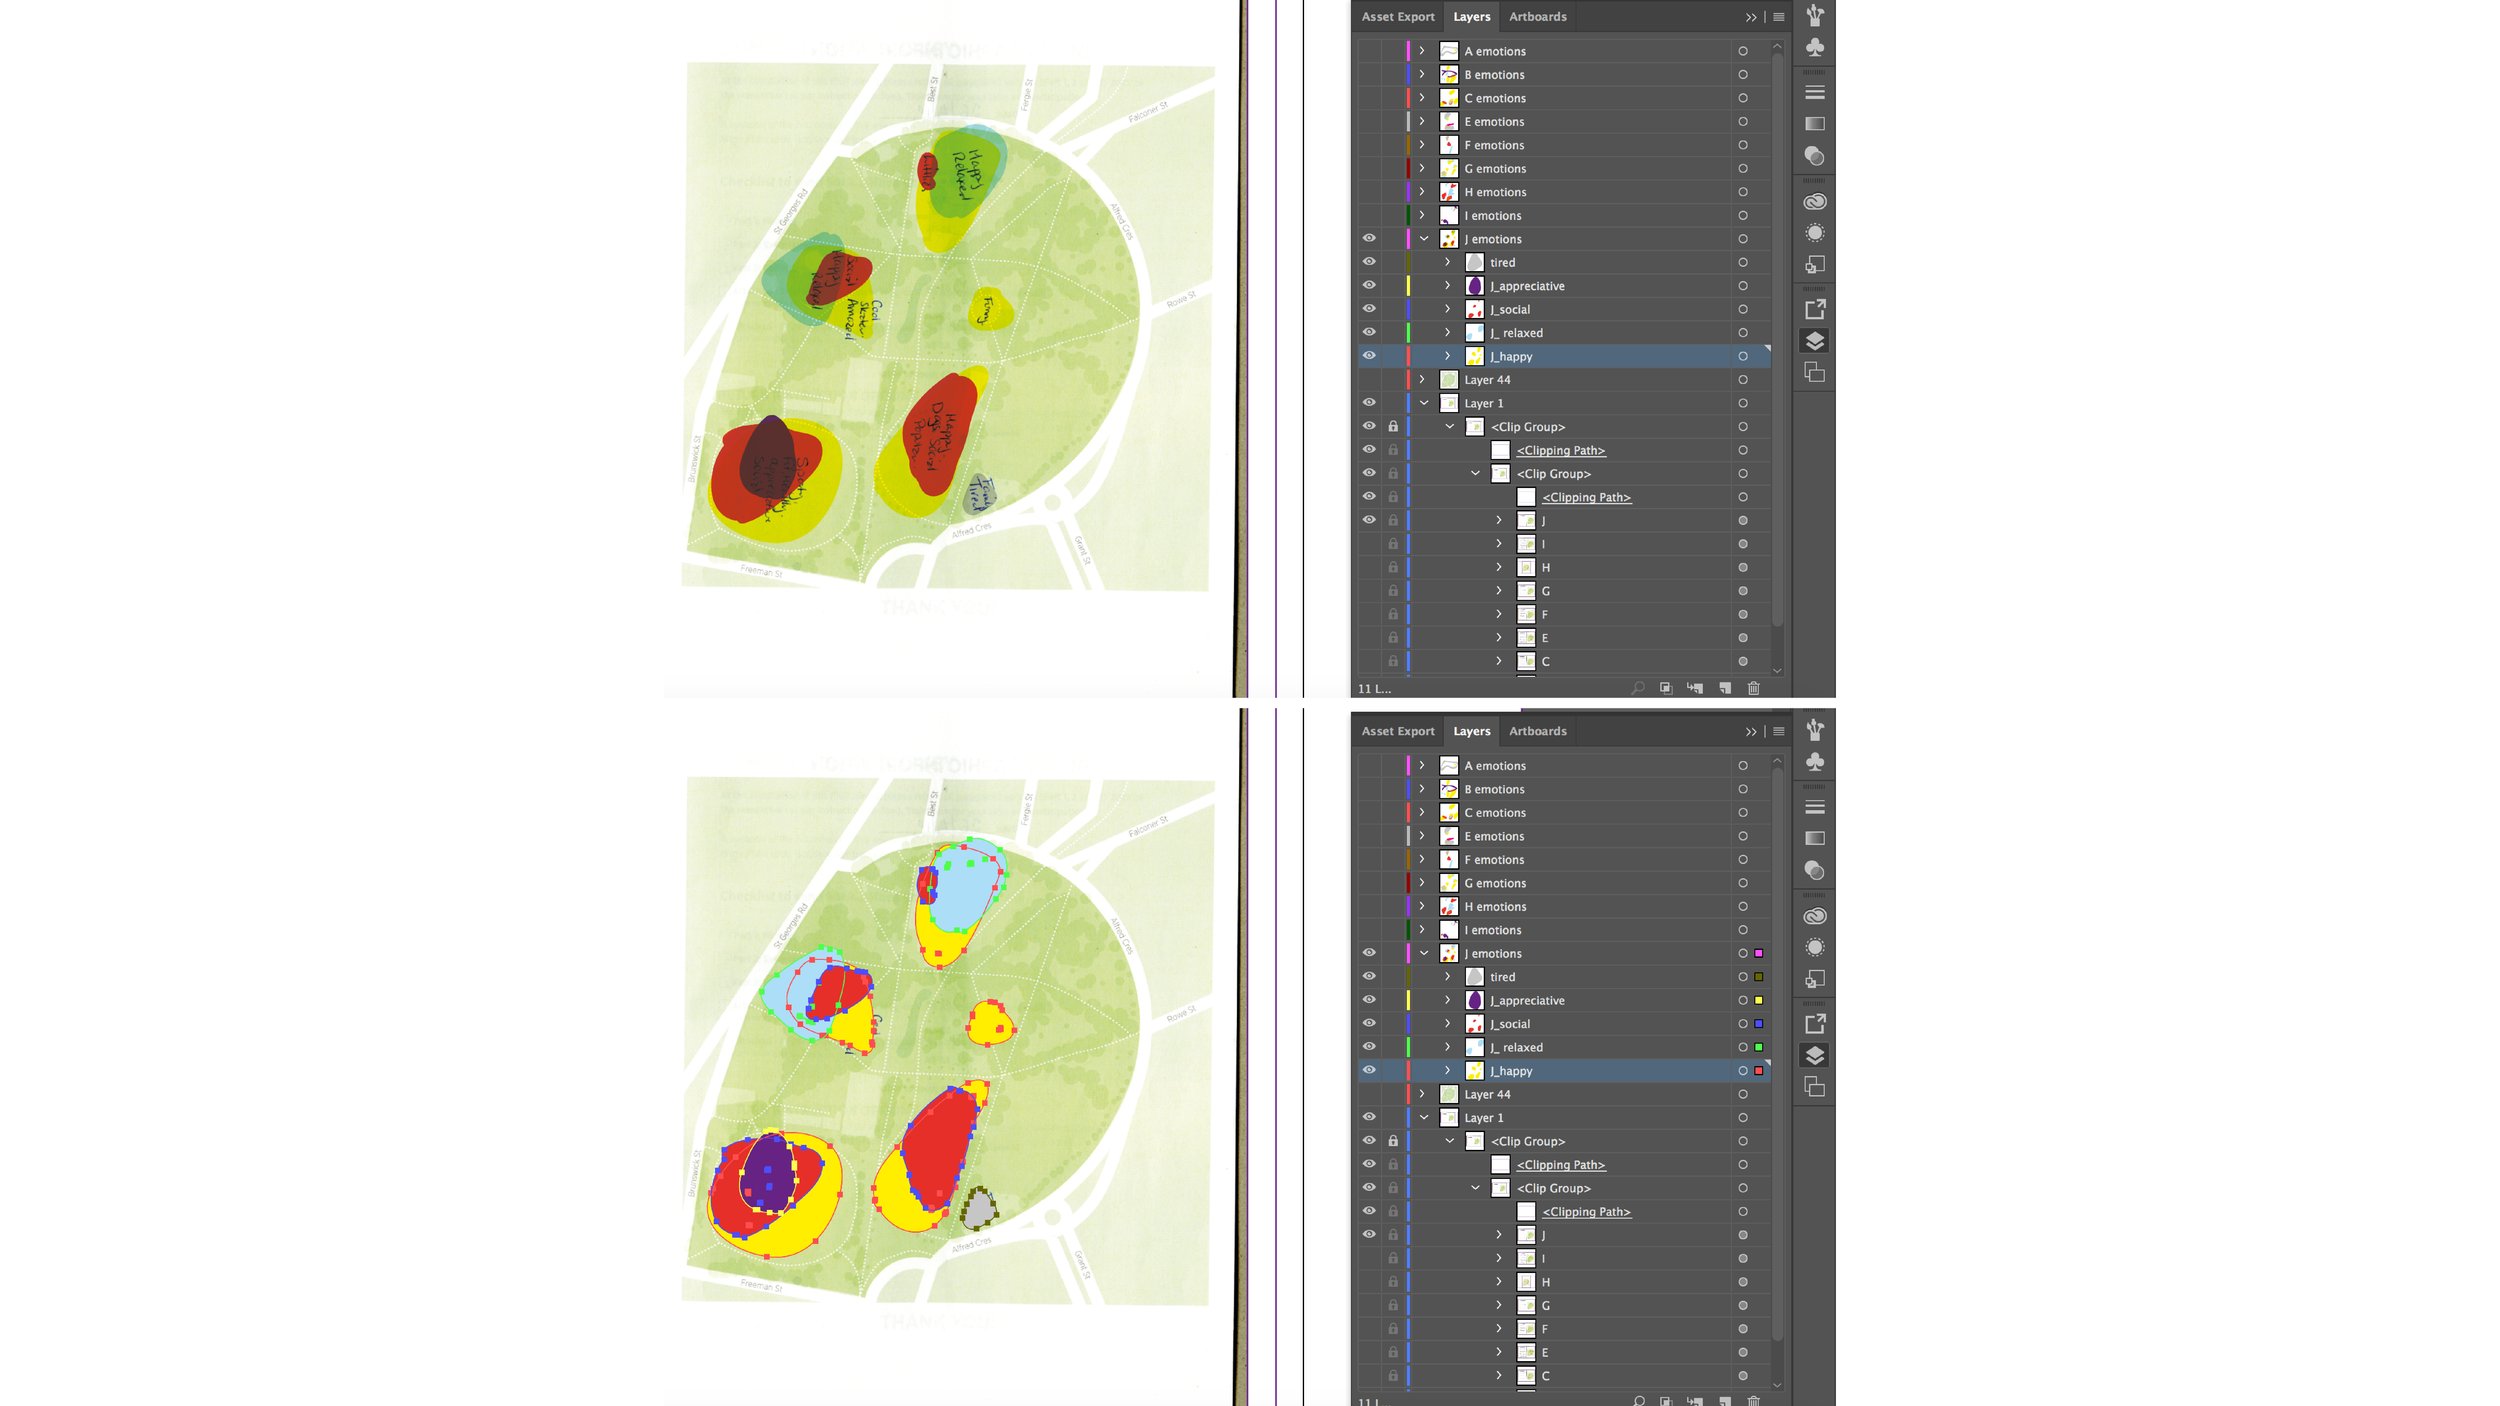
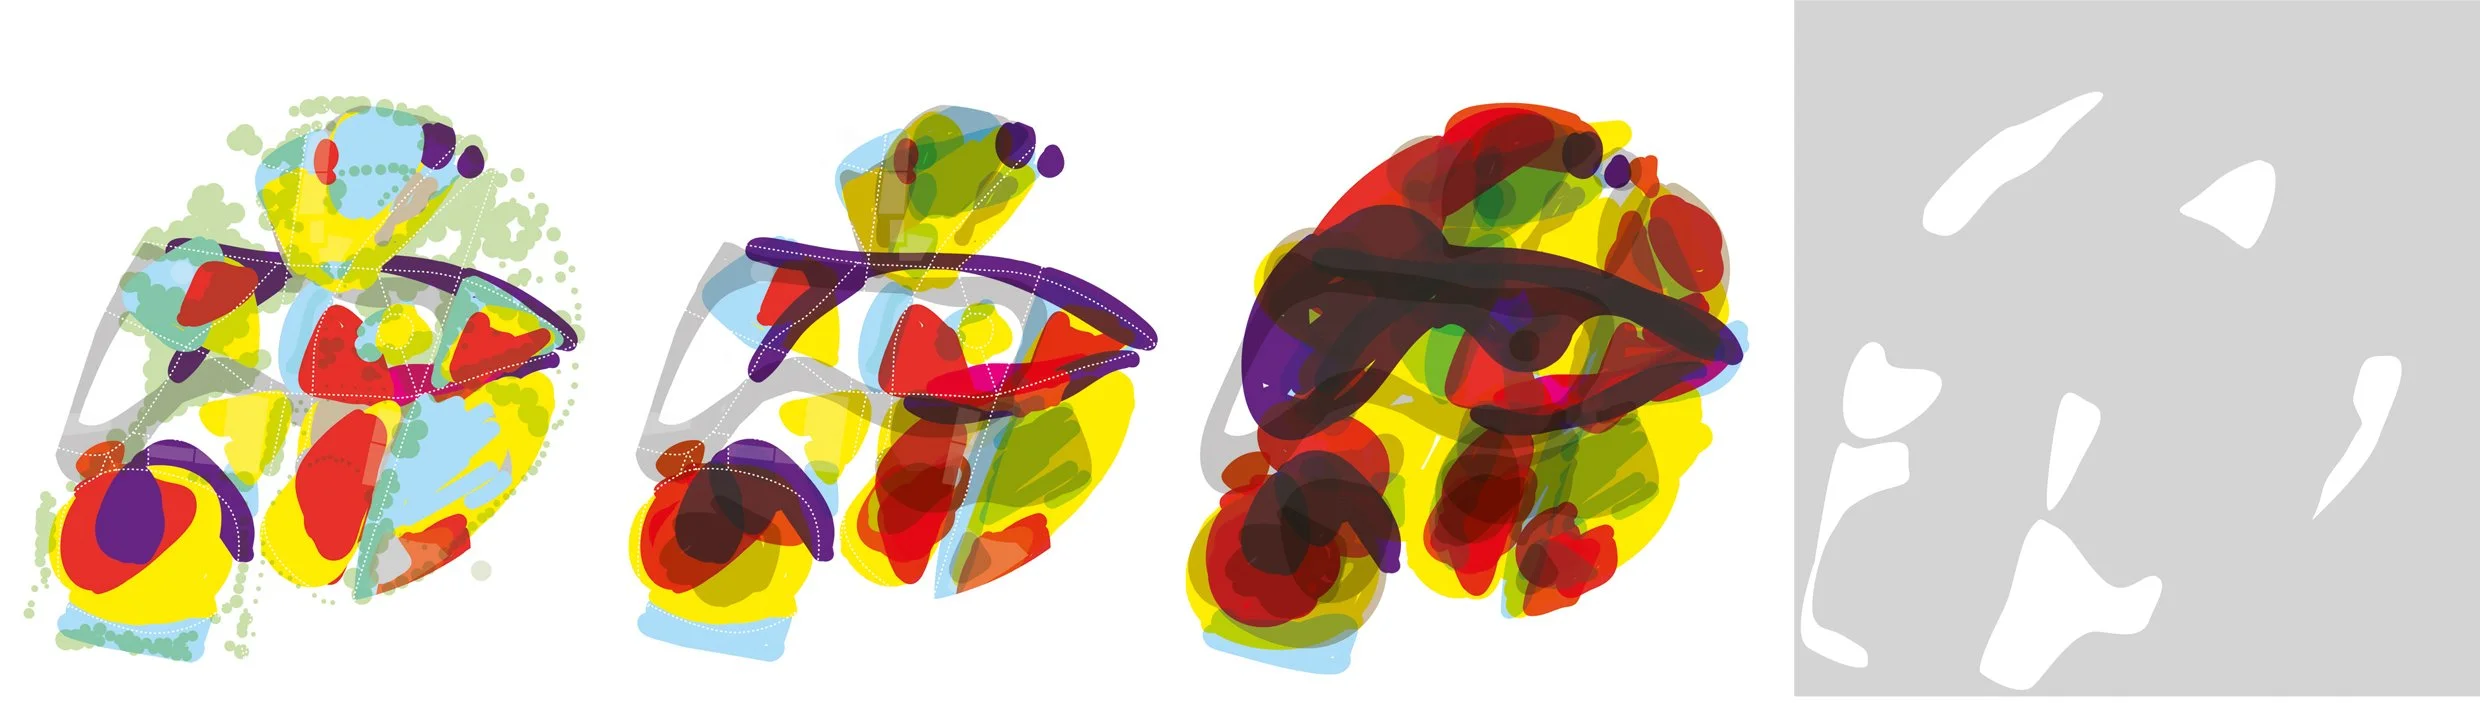
Layering the emotions on the base map
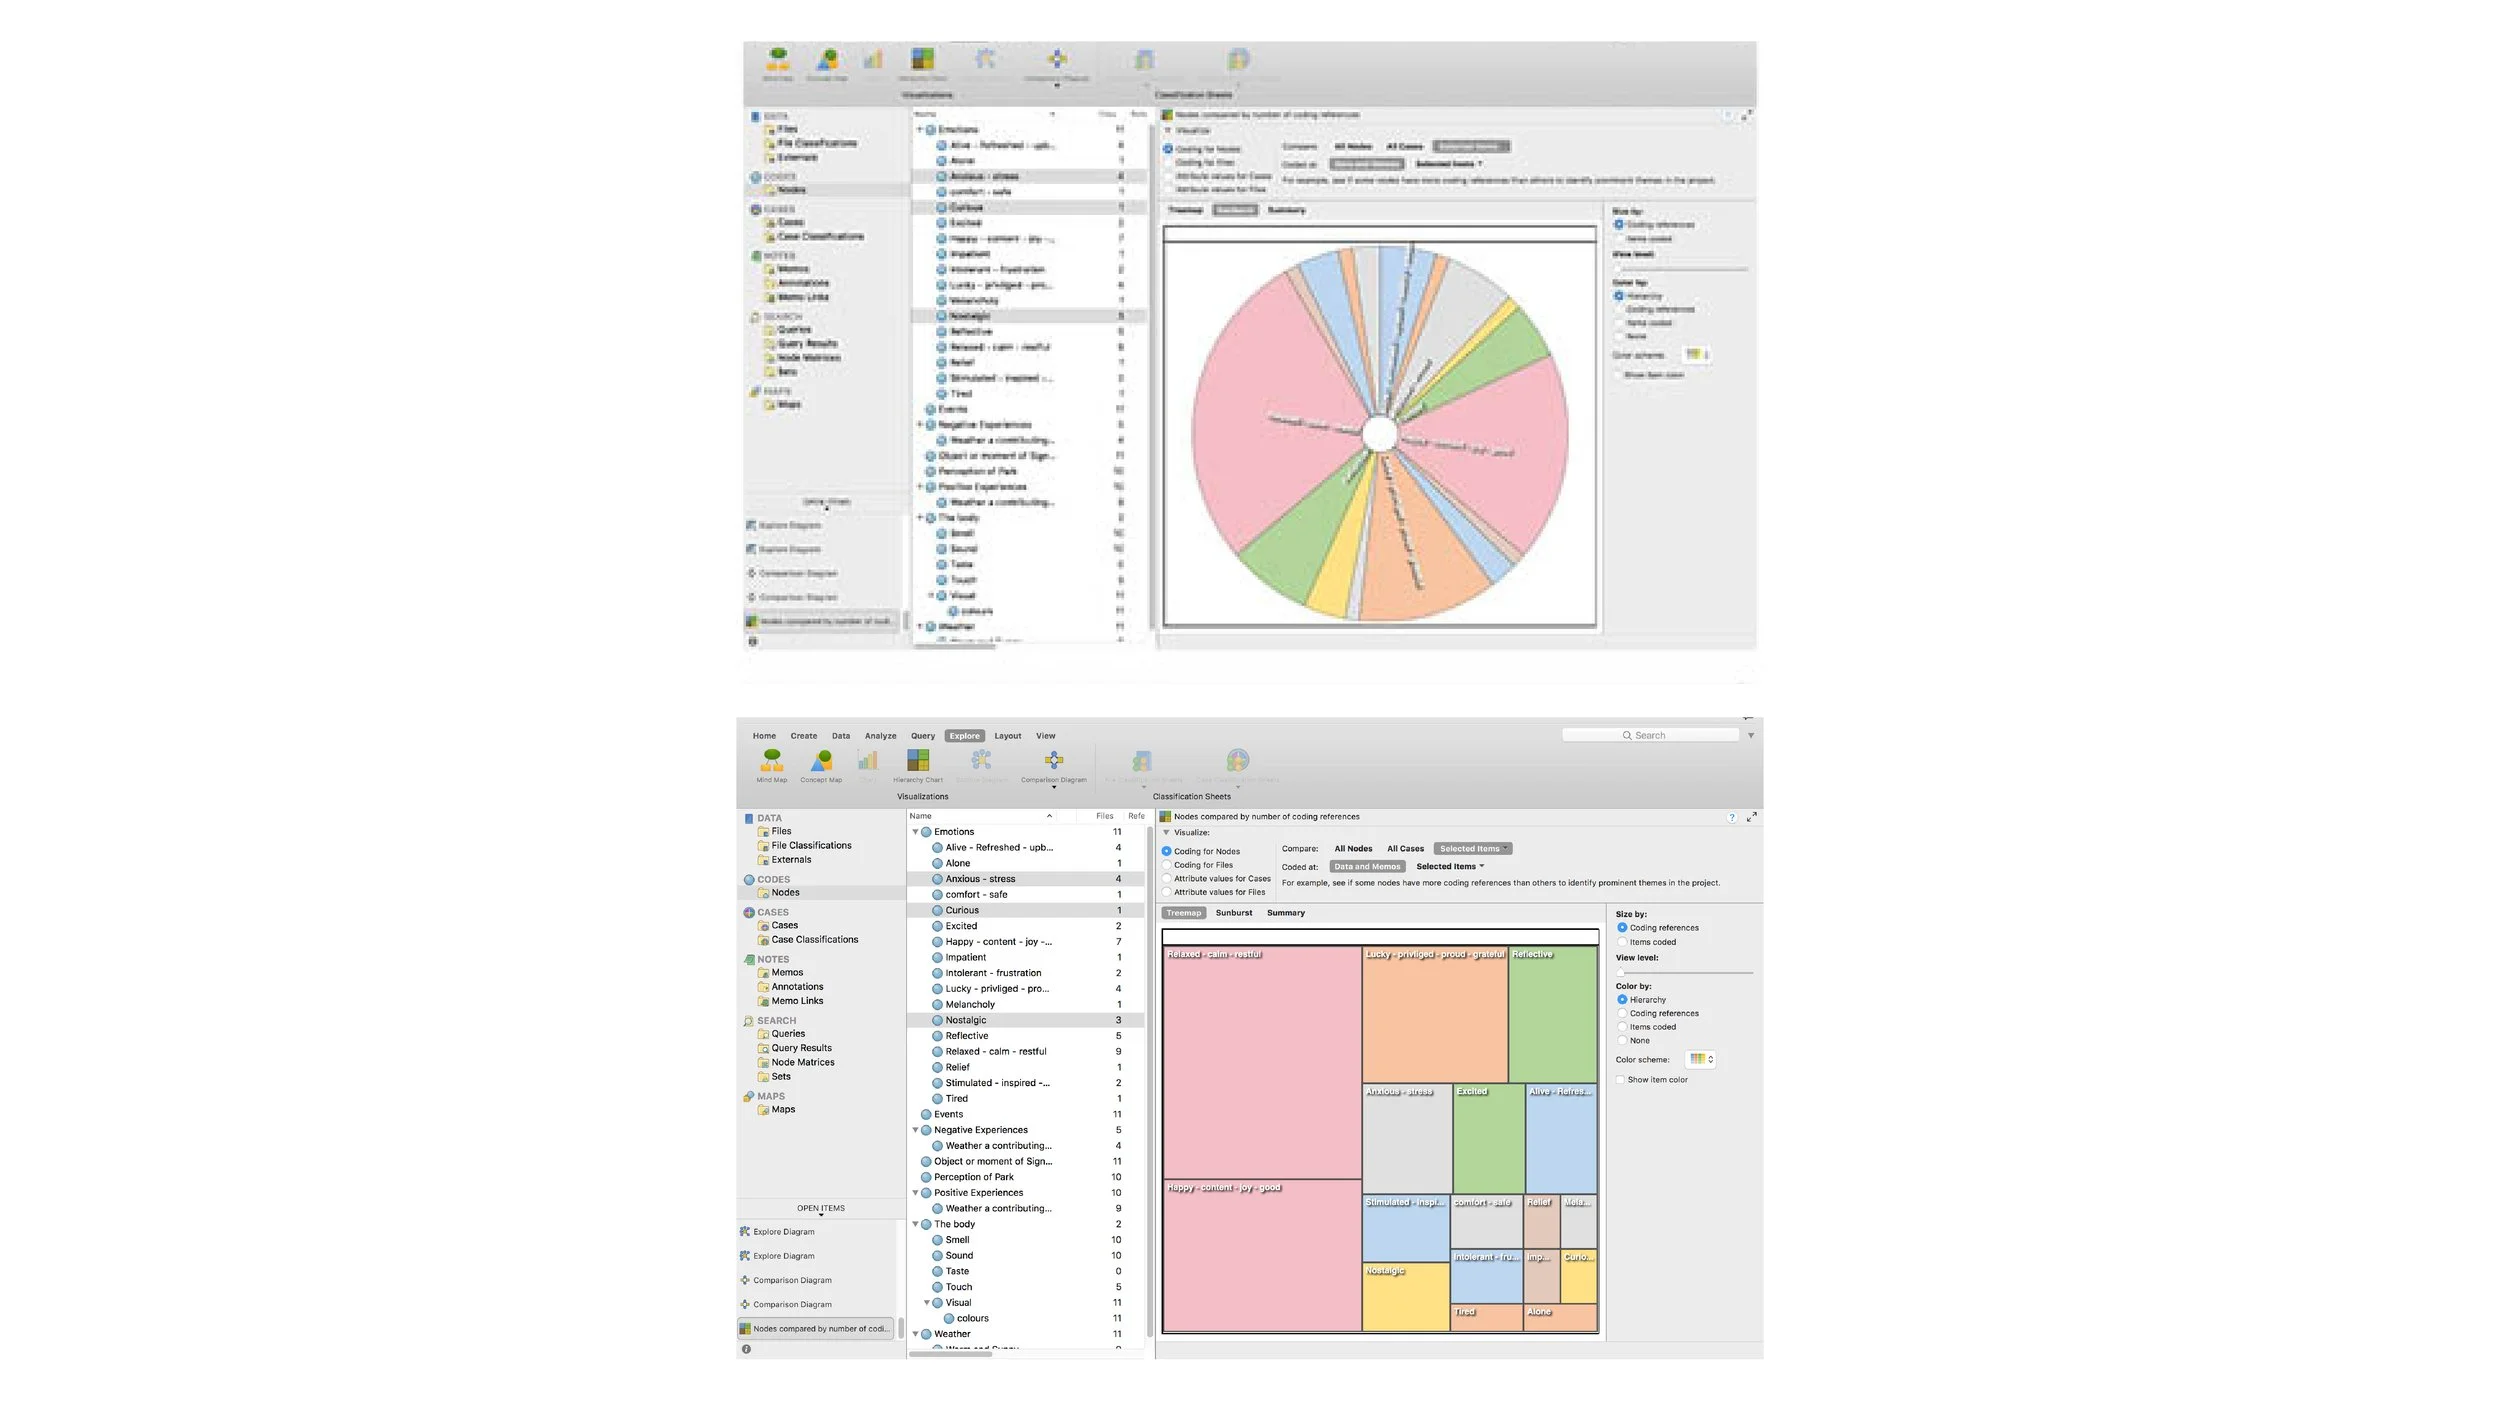
Coding the data in Nvivo

Individual participant's walks